
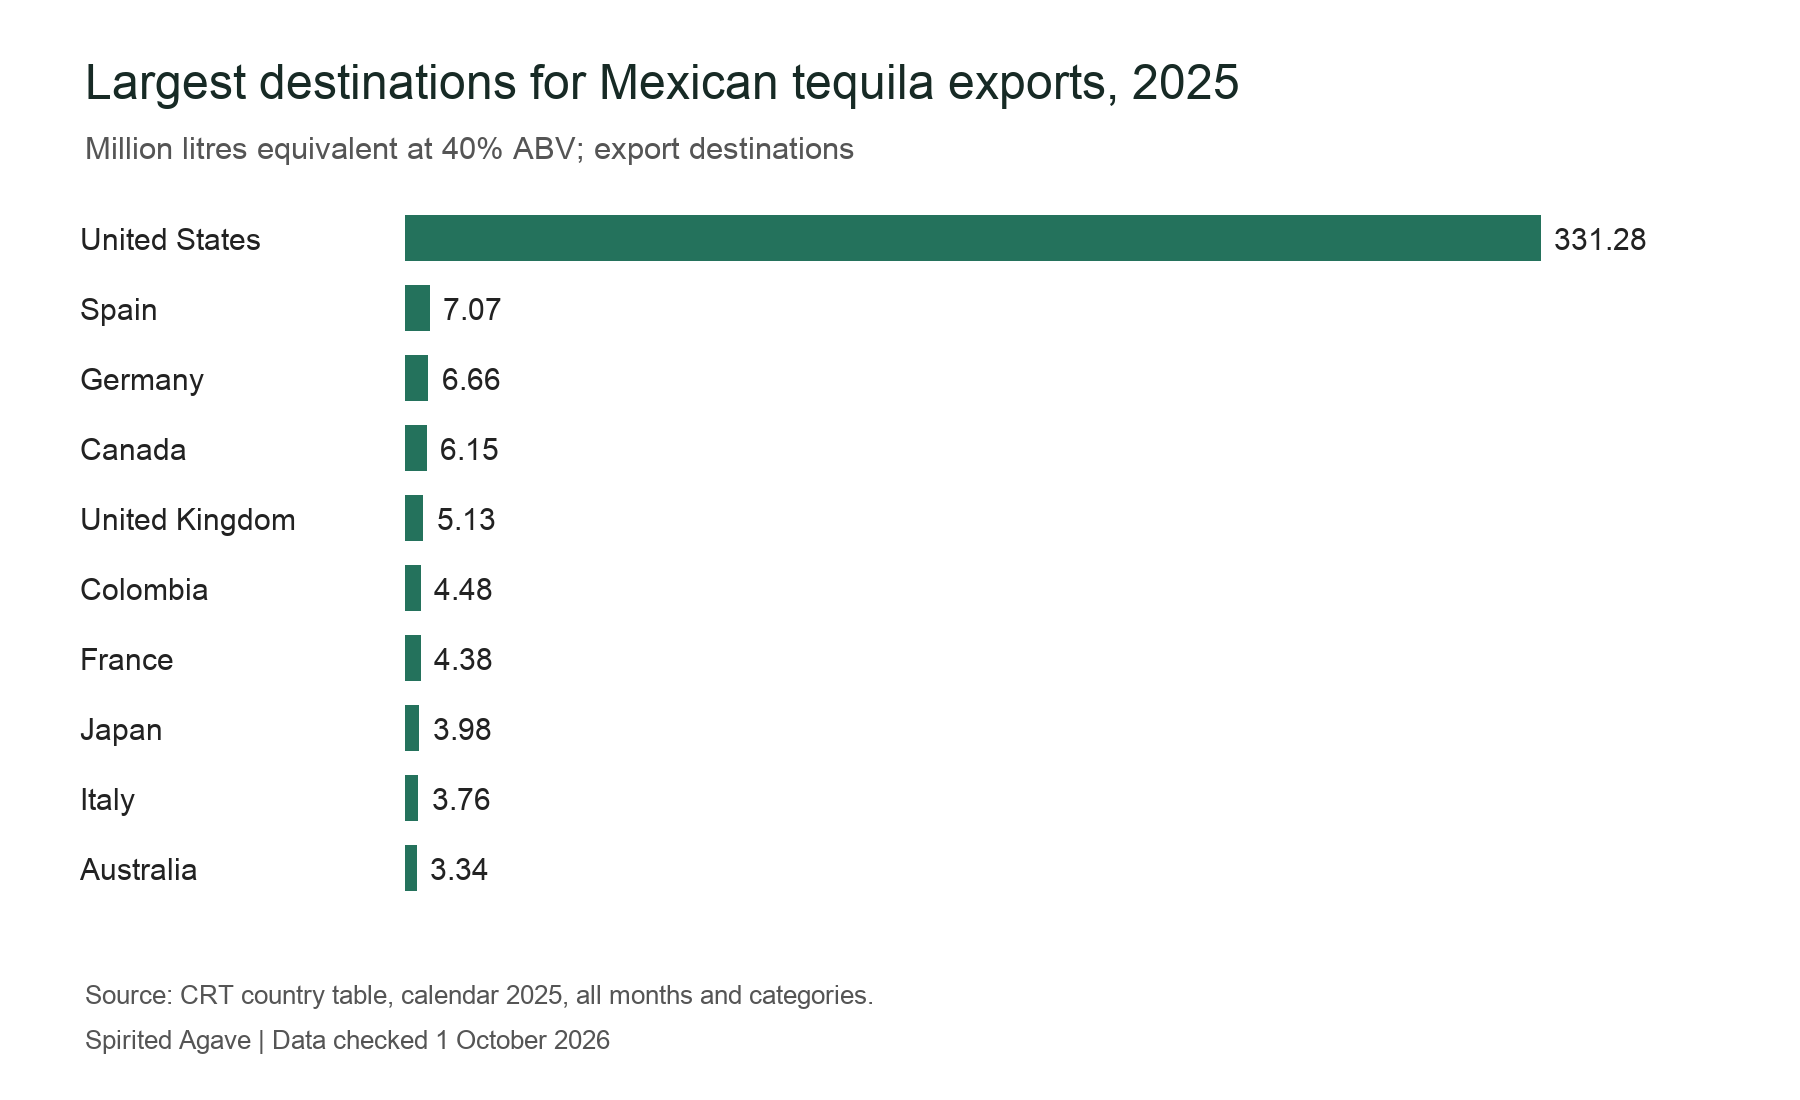
The United States is by far the largest destination for Mexican tequila exports. In 2025 it received 331.3 million liters, or 81.9% of CRT’s country-table total. Spain ranked second among export destinations, followed by Germany and Canada. Mexico is tequila’s home market and is outside this export ranking. Stocks and re-exports can make shipment destinations differ from where tequila is drunk. Source: CRT’s country export table.
The top ten tequila export destinations in 2025
The US received 331.3 million liters in 2025, compared with Spain’s 7.07 million and Germany’s 6.66 million. The CRT destination table reports a total of 404.54 million liters across 110 destinations, expressed at an equivalent alcohol strength of 40% ABV.
US shipments were about 47 times Spain’s in 2025. US sales of tequila and mezcal combined reached 32.106 million nine-liter cases in 2025, down 0.3% year on year, according to DISCUS’s 2025 tables.
Tequila production and exports in 2025
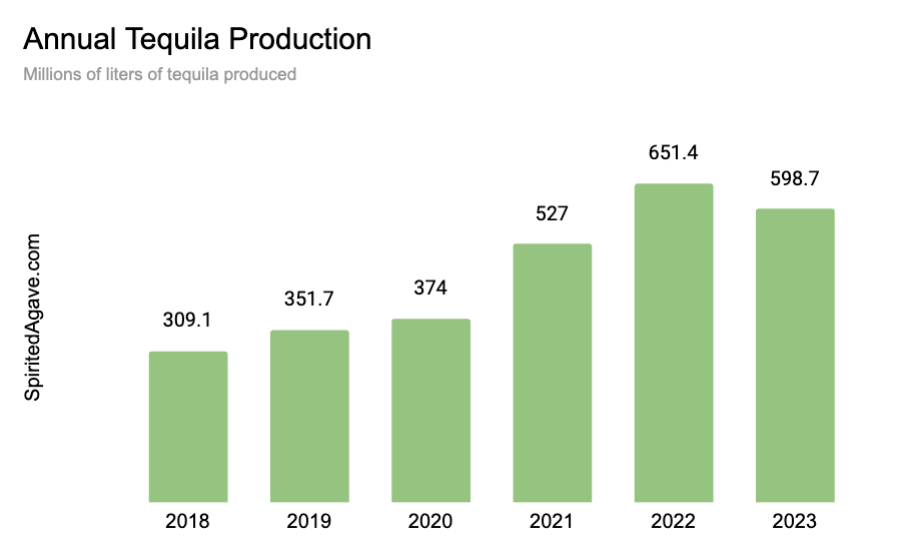
Mexico produced 583.53 million liters of tequila and exported 407.98 million liters in 2025, both expressed at 40% ABV in CRT’s annual summary. The country table has a different export total, 404.54 million liters, which is the basis for the country shares here. Subtracting exports from production does not give Mexican consumption: maturation, inventories and shipment timing also affect the totals. Source: CRT’s annual statistics.
Historical export growth in 2023
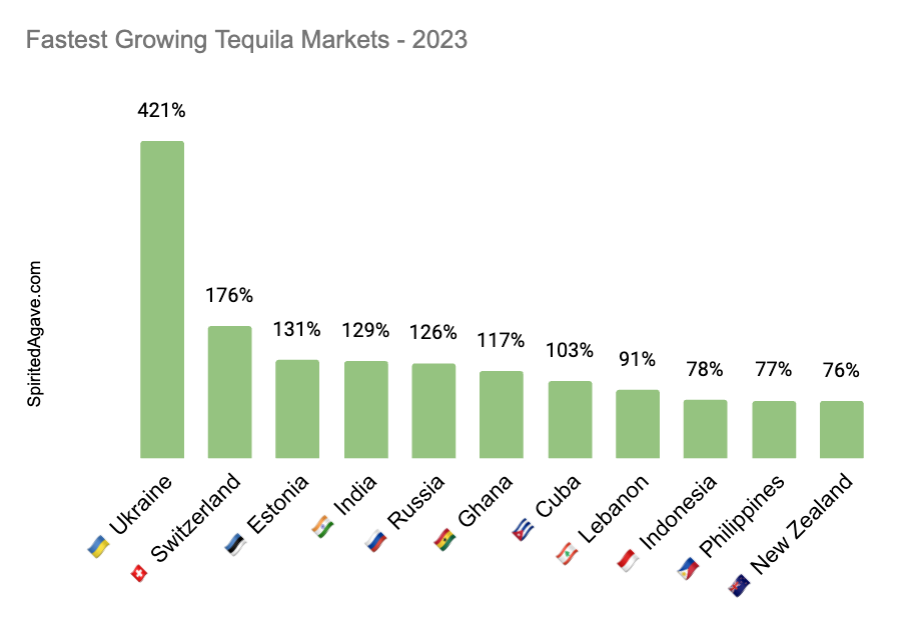
There were 58 countries with tequila imports over 100,000 liters in 2023. Of this group 7 grew at more than 100%, with the highest growers being Ukraine (+421%), Switzerland (+176%) and Estonia (+131%). The fastest growing countries were widely spread, with representatives from Europe, Asia, the Middle East, Latin America and Africa.
Historical export declines in 2023
27 countries reduced tequila imports in 2023. The largest percentage reductions in tequila imports were in Peru (-58%), Ecuador (-43%), Ireland (-38%) and Panama (-31%).
Tequila export destinations in 2025
All 110 destinations in CRT’s 2025 export table are ranked below by shipment volume. Shares use the table’s displayed total; the individually rounded rows add up to five liters more than that total.
| Rank | Destination | Liters at 40% ABV | Share of destination-table total |
|---|---|---|---|
| 1 | United States | 331,283,448 | 81.89% |
| 2 | Spain | 7,065,361 | 1.75% |
| 3 | Germany | 6,657,740 | 1.65% |
| 4 | Canada | 6,147,017 | 1.52% |
| 5 | United Kingdom | 5,125,479 | 1.27% |
| 6 | Colombia | 4,480,423 | 1.11% |
| 7 | France | 4,382,313 | 1.08% |
| 8 | Japan | 3,977,524 | 0.98% |
| 9 | Italy | 3,759,207 | 0.93% |
| 10 | Australia | 3,338,716 | 0.83% |
| 11 | China | 2,809,011 | 0.69% |
| 12 | India | 1,925,230 | 0.48% |
| 13 | Netherlands | 1,904,717 | 0.47% |
| 14 | Panama | 1,397,167 | 0.35% |
| 15 | Latvia | 1,360,526 | 0.34% |
| 16 | South Africa | 1,198,210 | 0.30% |
| 17 | Singapore | 1,118,298 | 0.28% |
| 18 | Philippines | 1,060,995 | 0.26% |
| 19 | United Arab Emirates | 1,038,322 | 0.26% |
| 20 | Belgium | 1,032,093 | 0.26% |
| 21 | Dominican Republic | 993,010 | 0.25% |
| 22 | Chile | 760,360 | 0.19% |
| 23 | Greece | 740,462 | 0.18% |
| 24 | Indonesia | 672,929 | 0.17% |
| 25 | Peru | 595,291 | 0.15% |
| 26 | Puerto Rico | 591,531 | 0.15% |
| 27 | Ecuador | 576,007 | 0.14% |
| 28 | Brazil | 573,753 | 0.14% |
| 29 | Nigeria | 517,945 | 0.13% |
| 30 | Turkey | 447,010 | 0.11% |
| 31 | Guatemala | 438,819 | 0.11% |
| 32 | South Korea | 432,959 | 0.11% |
| 33 | New Zealand | 360,291 | 0.09% |
| 34 | El Salvador | 352,398 | 0.09% |
| 35 | Poland | 272,410 | 0.07% |
| 36 | Honduras | 266,624 | 0.07% |
| 37 | Czech Republic | 261,220 | 0.06% |
| 38 | Israel | 260,480 | 0.06% |
| 39 | Switzerland | 248,342 | 0.06% |
| 40 | Costa Rica | 247,022 | 0.06% |
| 41 | Thailand | 237,317 | 0.06% |
| 42 | Ukraine | 214,669 | 0.05% |
| 43 | Lebanon | 175,454 | 0.04% |
| 44 | Russia | 171,958 | 0.04% |
| 45 | Sweden | 171,308 | 0.04% |
| 46 | Jamaica | 162,367 | 0.04% |
| 47 | Ghana | 152,475 | 0.04% |
| 48 | Bahamas | 152,116 | 0.04% |
| 49 | Hong Kong | 135,007 | 0.03% |
| 50 | Bolivia | 126,005 | 0.03% |
| 51 | Trinidad and Tobago | 125,077 | 0.03% |
| 52 | Kenya | 120,266 | 0.03% |
| 53 | Serbia | 110,724 | 0.03% |
| 54 | Taiwan | 107,597 | 0.03% |
| 55 | Portugal | 106,790 | 0.03% |
| 56 | Cuba | 101,804 | 0.03% |
| 57 | Bulgaria | 97,865 | 0.02% |
| 58 | Estonia | 93,095 | 0.02% |
| 59 | Ireland | 84,855 | 0.02% |
| 60 | Cyprus | 75,470 | 0.02% |
| 61 | Nicaragua | 73,350 | 0.02% |
| 62 | Slovakia | 72,817 | 0.02% |
| 63 | Malaysia | 64,040 | 0.02% |
| 64 | Jordan | 62,037 | 0.02% |
| 65 | US Virgin Islands | 61,722 | 0.02% |
| 66 | Argentina | 61,435 | 0.02% |
| 67 | Austria | 59,074 | 0.01% |
| 68 | Belarus | 47,170 | 0.01% |
| 69 | Romania | 45,761 | 0.01% |
| 70 | Georgia | 41,295 | 0.01% |
| 71 | Iraq | 40,668 | 0.01% |
| 72 | Qatar | 39,182 | 0.01% |
| 73 | Paraguay | 36,199 | 0.01% |
| 74 | Suriname | 32,849 | 0.01% |
| 75 | Cayman Islands | 32,483 | 0.01% |
| 76 | Hungary | 32,476 | 0.01% |
| 77 | Lithuania | 31,488 | 0.01% |
| 78 | Barbados | 29,524 | 0.01% |
| 79 | Vietnam | 27,747 | 0.01% |
| 80 | Netherlands Antilles | 22,955 | 0.01% |
| 81 | Guam | 21,113 | 0.01% |
| 82 | Venezuela | 21,047 | 0.01% |
| 83 | Sint Maarten | 19,256 | 0.00% |
| 84 | Aruba | 19,231 | 0.00% |
| 85 | Uruguay | 16,859 | 0.00% |
| 86 | Moldova | 13,527 | 0.00% |
| 87 | British Virgin Islands | 12,987 | 0.00% |
| 88 | Azerbaijan | 12,693 | 0.00% |
| 89 | Saint Kitts and Nevis | 11,016 | 0.00% |
| 90 | Armenia | 10,305 | 0.00% |
| 91 | Denmark | 9,442 | 0.00% |
| 92 | Croatia | 8,835 | 0.00% |
| 93 | Belize | 8,418 | 0.00% |
| 94 | Djibouti | 7,826 | 0.00% |
| 95 | Sri Lanka | 7,200 | 0.00% |
| 96 | Bermuda | 7,182 | 0.00% |
| 97 | Morocco | 6,825 | 0.00% |
| 98 | Albania | 6,282 | 0.00% |
| 99 | Uganda | 4,624 | 0.00% |
| 100 | Saint Lucia | 1,733 | 0.00% |
| 101 | Turks and Caicos Islands | 1,287 | 0.00% |
| 102 | North Macedonia | 1,285 | 0.00% |
| 103 | Antigua and Barbuda | 1,155 | 0.00% |
| 103 | Grenada | 1,155 | 0.00% |
| 105 | Slovenia | 853 | 0.00% |
| 106 | Tanzania | 423 | 0.00% |
| 107 | Monaco | 176 | 0.00% |
| 108 | Cambodia | 25 | 0.00% |
| 109 | Bhutan | 5 | 0.00% |
| 110 | Togo | 2 | 0.00% |
Read more about the tequila market
Sources: CRT’s country export table and CRT’s annual statistics, calendar 2025, observed 1 October 2026; DISCUS’s 2025 tables for the separately defined US sales figures. The historical charts show annual production through 2023 and export growth in 2023.